Welcome to
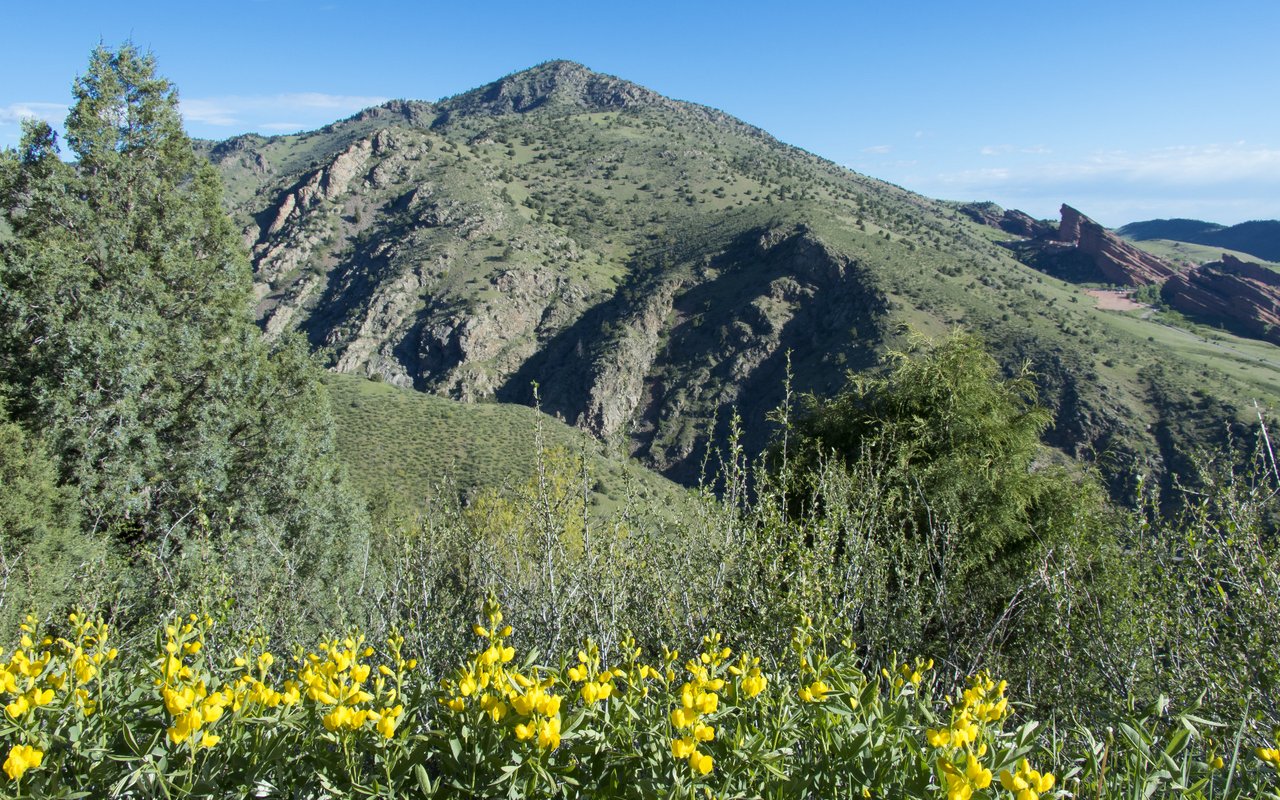
Indian Hills
Discover Indian Hills real estate market trends, including home values, neighborhood insights, and housing updates. Learn more today!
Discover the perfect home in Indian Hills, Colorado with our comprehensive real estate website. Browse all available homes for sale in the area, including information on the latest market trends, school districts, and the most updated listings. Explore the vibrant neighborhoods and communities near Indian Hills, Colorado with our interactive map, which details local restaurants, shopping, and amenities. Stay informed with up-to-date information on sold homes and demographics. Find your ideal home and or list yours with our user-friendly website. Start your real estate journey today in Indian Hills, Colorado.
1,320 people live in Indian Hills, where the median age is 48.2 and the average individual income is $73,312. Data provided by the U.S. Census Bureau.
Total Population
Median Age
Population Density
Average individual Income
There's plenty to do around Indian Hills, including shopping, dining, nightlife, parks, and more. Data provided by Walk Score and Yelp.
Explore popular things to do in the area, including Evergreen Library - Jefferson County Public Library, Surf'SUP Colorado, and Evergreen Pilates.
| Name | Category | Distance | Reviews |
Ratings by
Yelp
|
|---|---|---|---|---|
| Shopping | 3.87 miles | 9 reviews | 5/5 stars | |
| Shopping | 4.97 miles | 24 reviews | 5/5 stars | |
| Active | 4.19 miles | 6 reviews | 5/5 stars | |
| Active | 3.21 miles | 7 reviews | 4.9/5 stars | |
|
|
||||
|
|
||||
|
|
||||
|
|
||||
|
|
||||
|
|
Indian Hills has 549 households, with an average household size of 2.4. Data provided by the U.S. Census Bureau. Here’s what the people living in Indian Hills do for work — and how long it takes them to get there. Data provided by the U.S. Census Bureau. 1,320 people call Indian Hills home. The population density is 243.32 and the largest age group is Data provided by the U.S. Census Bureau.
Total Population
Population Density Population Density This is the number of people per square mile in a neighborhood.
Median Age
Men vs Women
Population by Age Group
0-9 Years
10-17 Years
18-24 Years
25-64 Years
65-74 Years
75+ Years
Education Level
Total Households
Average Household Size
Average individual Income
Households with Children
With Children:
Without Children:
Blue vs White Collar Workers
Blue Collar:
White Collar:

1041 S Gaylord St Denver CO 80209
1041 S Gaylord St Denver CO 80209