Welcome to
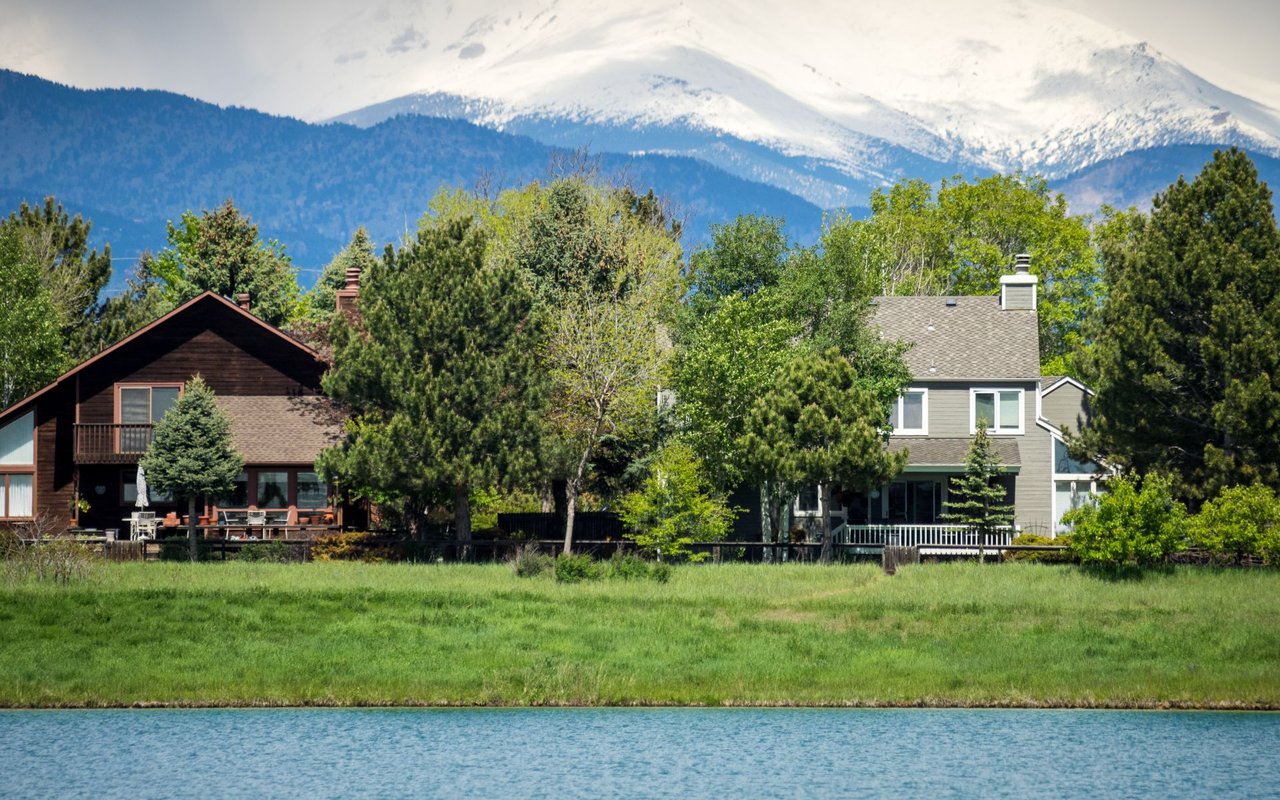
Applewood Valley Lakewood CO Real Estate & Homes
Explore the vibrant neighborhoods and communities near Applewood Valley, Lakewood, Colorado with our interactive map
9,391 people live in Applewood Valley, where the median age is 50 and the average individual income is $67,067. Data provided by the U.S. Census Bureau.
Total Population
Median Age
Population Density
Average individual Income
There's plenty to do around Applewood Valley, including shopping, dining, nightlife, parks, and more. Data provided by Walk Score and Yelp.
Explore popular things to do in the area, including Beerman, Olde Town Nutrition, and Golden Yoga & Healing Arts.
| Name | Category | Distance | Reviews |
Ratings by
Yelp
|
|---|---|---|---|---|
| Dining · $$ | 0.8 miles | 11 reviews | 5/5 stars | |
| Dining | 4.21 miles | 6 reviews | 4.8/5 stars | |
| Active | 3.43 miles | 9 reviews | 4.8/5 stars | |
| Beauty | 3.87 miles | 13 reviews | 5/5 stars | |
| Beauty | 2.27 miles | 19 reviews | 5/5 stars | |
| Beauty | 2.18 miles | 9 reviews | 5/5 stars | |
|
|
||||
|
|
||||
|
|
||||
|
|
||||
|
|
||||
|
|
Applewood Valley has 4,277 households, with an average household size of 2. Data provided by the U.S. Census Bureau. Here’s what the people living in Applewood Valley do for work — and how long it takes them to get there. Data provided by the U.S. Census Bureau. 9,391 people call Applewood Valley home. The population density is 4,722 and the largest age group is Data provided by the U.S. Census Bureau.
Total Population
Population Density Population Density This is the number of people per square mile in a neighborhood.
Median Age
Men vs Women
Population by Age Group
0-9 Years
10-17 Years
18-24 Years
25-64 Years
65-74 Years
75+ Years
Education Level
Total Households
Average Household Size
Average individual Income
Households with Children
With Children:
Without Children:
Blue vs White Collar Workers
Blue Collar:
White Collar:

1041 S Gaylord St Denver CO 80209
1041 S Gaylord St Denver CO 80209